
Work

A few things we've built.

Case Studies

Two products, in production.

Mobile App

RatneshGold

Jewellery retail app

A jewellery shop's catalog changes with the gold rate, and its photography is the whole sell. RatneshGold ties the two together: live rate tracking, a catalog synced to real inventory down to net and gross weight, AR try-on, and an AI photography engine that turns one raw shot into four ready-to-post versions.

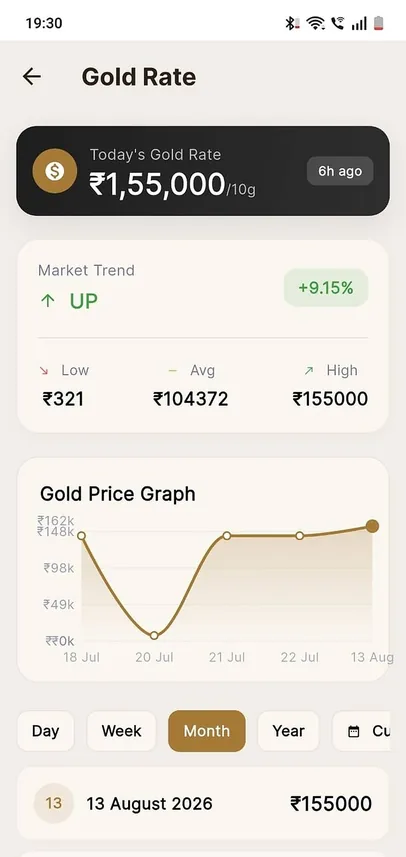
  • Live gold rate with day / week / month / year trend charts
  • AR try-on for rings, chains & sets
  • Catalog priced live off the rate, per piece, by weight

One photo in. Four listings out.

A staff member photographs a piece on the counter. The app returns it worn by a model, on a display stand, lit as a cinematic still, and cut out on white — the four shots a listing actually needs, from the one shot a shop can realistically take.

Four AI-generated versions of the same gold necklace and earring set, labelled Model Wearing, On Display Stand, Cinematic Photo, and Standard / White Background.
The four versions the engine returns, shown at full capture size. Model wearing, display stand, cinematic, white background.
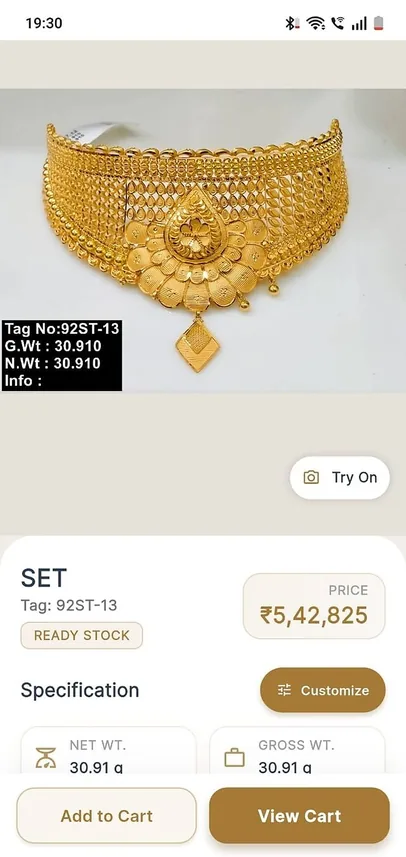
RatneshGold product detail screen showing a gold choker with tag number, net weight, gross weight and a live price.
Catalog, priced liveTag number, net and gross weight, and a price that moves with the rate.
RatneshGold live gold rate screen showing today's rate, market trend, low, average and high, and a price graph with day, week, month and year toggles.
Live rateToday's rate, the market trend, and the graph behind it — day to year.
View all 8 screens Full interface
Opens full size — arrow keys to move, Esc to close.

RatneshGold home screen with search, a promotional banner and quick links to AR demo and collections.
Home
Live gold rate screen with today’s rate, market trend, low, average, high and a price graph.
Live gold rate
Collections screen listing the 18K, 20K and 22K ranges with purity noted for each.
Collections
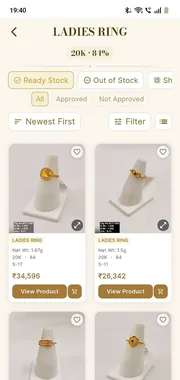
Ladies ring catalog with stock filters, sorting and per-piece weight and price.
Catalog
Product detail for a gold choker showing tag number, net and gross weight, price and try-on.
Product detail
The four AI-generated versions of one product photograph.
AI photography
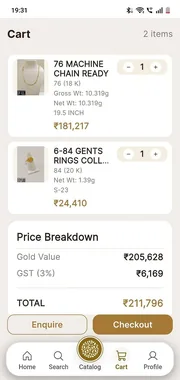
Cart with per-item weights and a price breakdown of gold value, GST and total.
Cart
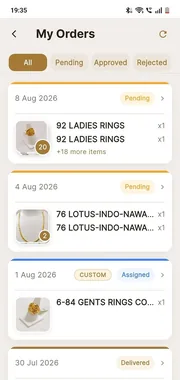
Order list grouped by date with pending, approved, custom and delivered states.
My orders
Custom Software

Data Fusion

Enterprise data-quality platform

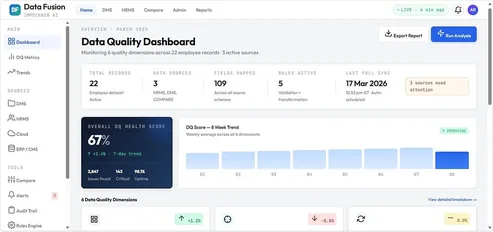
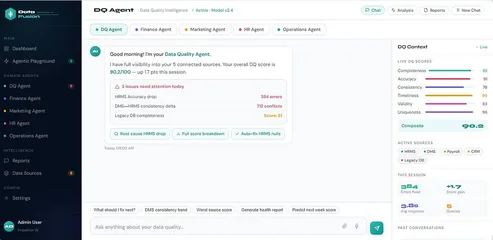
Employee data was scattered across a legacy HRMS, SharePoint and spreadsheets, and nobody could say which copy was right. Data Fusion scores every record across six quality dimensions, reconciles conflicts field by field, and puts an agent on top that can explain a bad score and fix it.

  • Six-dimension scoring across every connected source
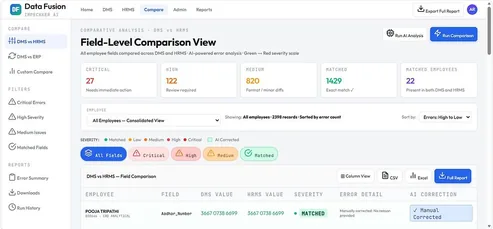
  • Field-level DMS ↔ HRMS reconciliation, ranked by severity
  • Agent actions: root-cause a drop, break down a score, auto-fix nulls
6Quality dimensions scored
2,398Fields compared across sources
1,429Exact matches confirmed
27Critical conflicts surfaced
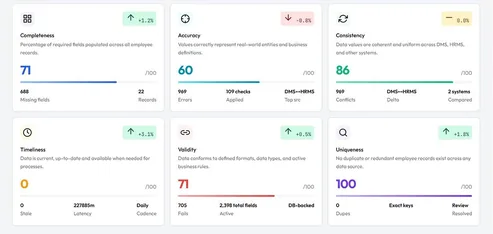
Three Data Fusion quality dimension cards: Completeness 71 out of 100 with 688 missing fields, Accuracy 60 with 969 errors and 109 checks applied, Consistency 86 with 969 conflicts across two systems.
Three of the six dimensions, at capture size. Each score carries its own evidence — missing fields, errors, checks applied, systems compared. Scroll the panel sideways to read it all.
Data Fusion field comparison row: employee Pooja Tripathi, field Aadhar_Number, the DMS value and HRMS value shown side by side, severity marked MATCHED, and an AI correction column reading Manual Corrected.
The reconciliation view. One employee, one field, both source systems, and what was done about the difference. Scroll the panel sideways to read it all.
View all 6 screens Full interface
Use “Actual size” in the viewer to read the dashboards at 1:1.
Dashboard with total records, data sources, fields mapped, rules active and an eight-week DQ trend.
Data quality dashboard
All six quality dimensions scored out of 100, each with its supporting counts.
Six quality dimensions
Field-level comparison of DMS against HRMS, with severity counts and a per-field diff table.
Field-level comparison
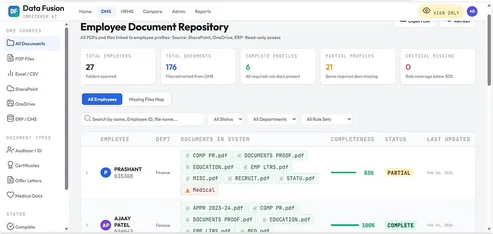
Employee document repository showing completeness and last-updated status per record.
Document repository
The data quality agent reporting issues that need attention, with root-cause and auto-fix actions.
DQ agent
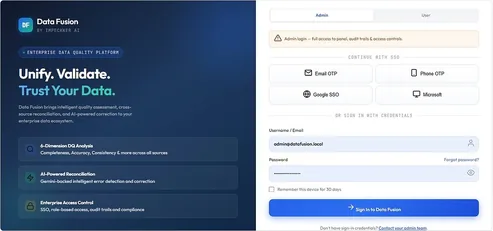
Sign-in screen with email and phone OTP, SSO options and role-based access notes.
Secure login
Prototype

And one we built to prove a point.

Web App

Beamline

Ops & lead management · structural steel

Built as a working prototype for a structural steel supplier, not a live deployment. Everything shown below runs, but on simulated data.

A steel supplier was taking enquiries on five channels and tracking them by hand, so a quote's accuracy depended on whoever happened to answer. Beamline collapses all five into one queue, matches each enquiry to live stock and price, and drafts the reply against those numbers.

  • One inbox for five lead channels, auto-matched to SKU & price
  • Drafted quotes and replies, quoting real stock and rate
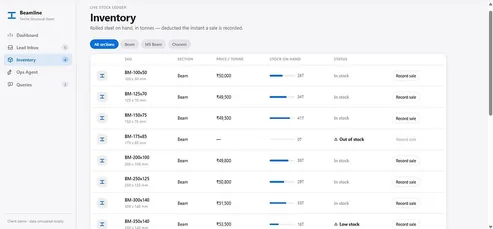
  • Live stock ledger with low / out-of-stock alerts

Arrives on

GmailLinkedInWhatsAppTelegramCRM Sync

Lands in

One queueEvery channel, one order, scored

Matched to

SKU & priceLive tonnage on hand, current rate

Comes back as

A drafted replyQuoting that stock, at that price

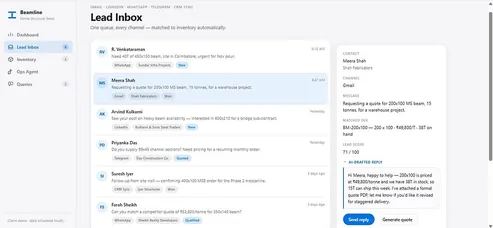
Beamline lead inbox: six enquiries tagged by channel and status, with a side panel showing the selected lead's matched SKU, price per tonne, tonnage on hand, lead score, and a drafted reply quoting those exact figures.
The whole mechanism in one frame. An enquiry for 200×100 MS beam resolves to BM-200x100 at ₹49,800 a tonne with 38T on hand — and the drafted reply quotes both. Scroll the panel sideways to read it all.
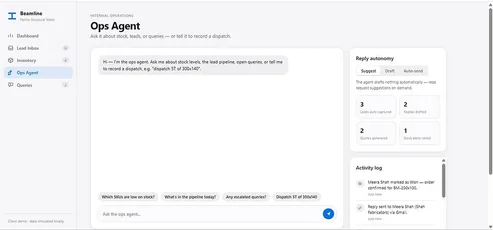
Beamline reply autonomy control set to Suggest, with Draft and Auto-send as the other options, above counters for leads auto-captured, replies drafted, quotes generated and stock alerts raised.
Autonomy is a setting, not a default. Suggest, draft, or auto-send — the shop decides how much rope the agent gets.
View all 5 screens Full interface
Use “Actual size” in the viewer to read the dashboards at 1:1.
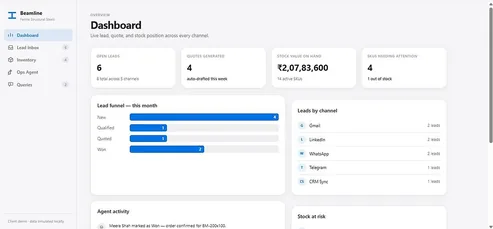
Ops dashboard with open leads, quotes generated, quoted value and a lead funnel by channel.
Ops dashboard
Lead inbox with enquiries from five channels and a side panel showing the matched SKU and drafted reply.
Lead inbox
Live stock ledger by SKU with tonnage on hand and low or out-of-stock alerts.
Live inventory
The ops agent with its reply-autonomy setting and an activity log of what it has done.
Ops agent
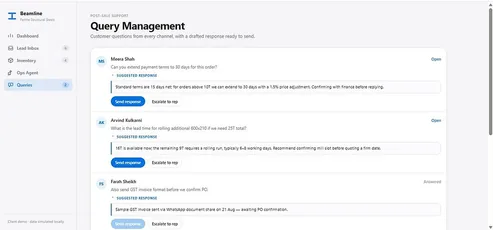
Post-sale query queue with status and escalation.
Query management

Want to be our next case study?

Let's talk about what you're building.

Start a Project